1、 Welcome to CuAS
CuAS is an alternative splicing (AS) database in cucumbers based on RNA-Seq data, which focuses on functional annotation and tissue-specific splicing. In this website, based on RNA-Seq data from different tissues, we depict the dynamic of splicing events across tissues in cucumbers. Meanwhile, we concentrate on the functional annotation and the functional elements at the isoform level, rather than at the gene level.
2、 Search
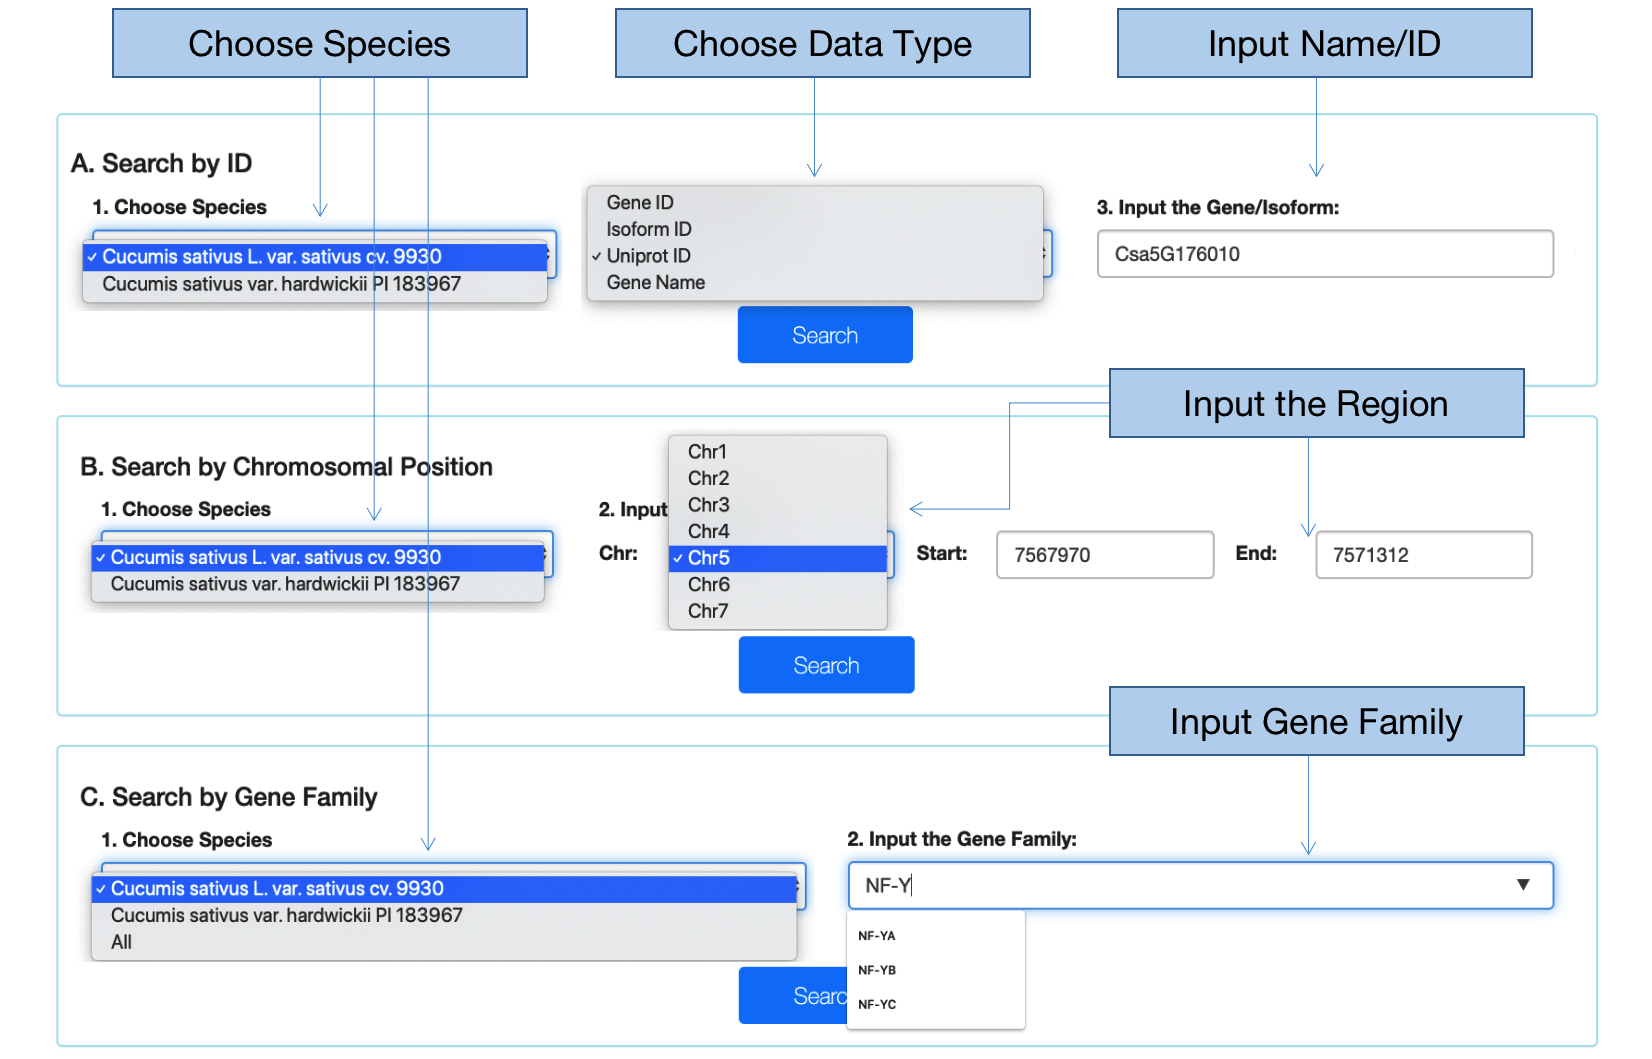
2.1 Input gene ID, isoform ID, UniProt ID or gene name
After choosing the species, the data type and inputting the ID or name that you are interested in, you can go to the result page by clicking the “Search” button. The result page is organized at three levels: gene, transcript, and isoform levels. Meanwhile, the structures of transcripts are displayed by JBrowse. If an isoform ID is put into, the page of the isoform features is directly gotten.
2.2 Input chromosomal position
CuAS also supports the search by chromosomal location. If the species is chosen, after you input the interested region and click the “Search” button, a list of gene IDs is able to be obtained. Once clicking a gene ID, the page will turn to the result page of the gene.
2.3 Input gene family
After selecting the species and gene family, a list of genes in the family is available. Clicking the gene ID will turn to the result page of the gene.
3、 Gene search result
Take Csa5G176010 as an example to demonstrate this manual.The results are organized into four parts.
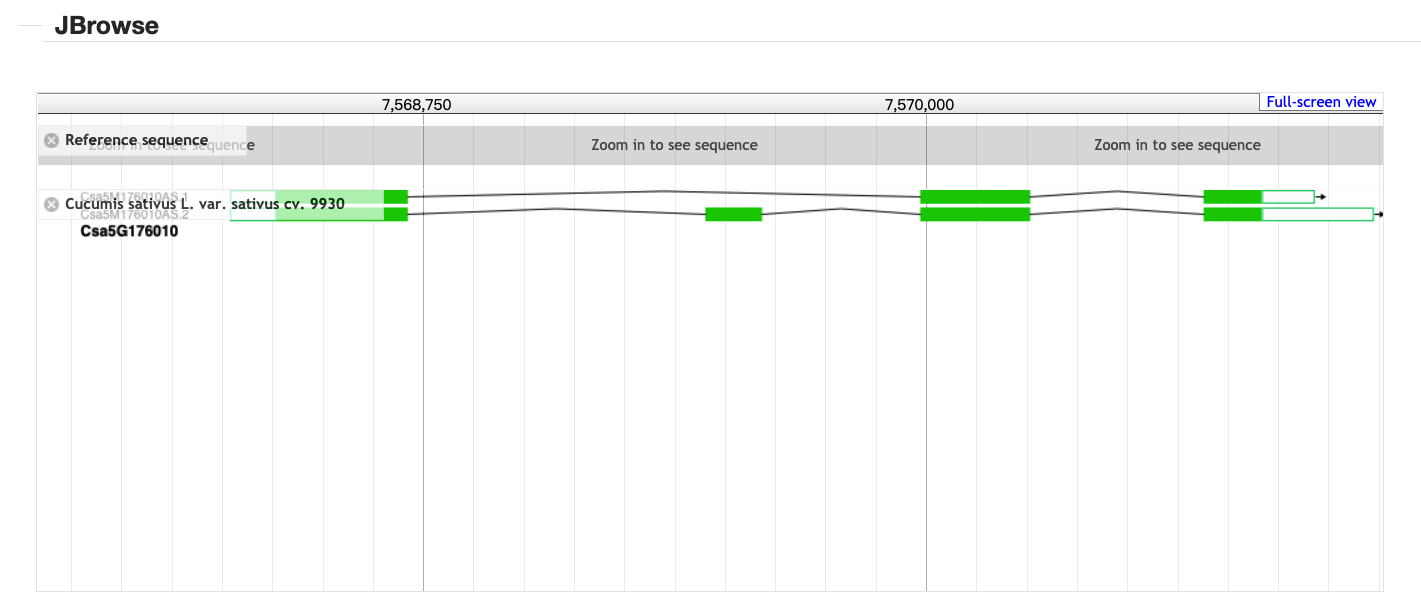
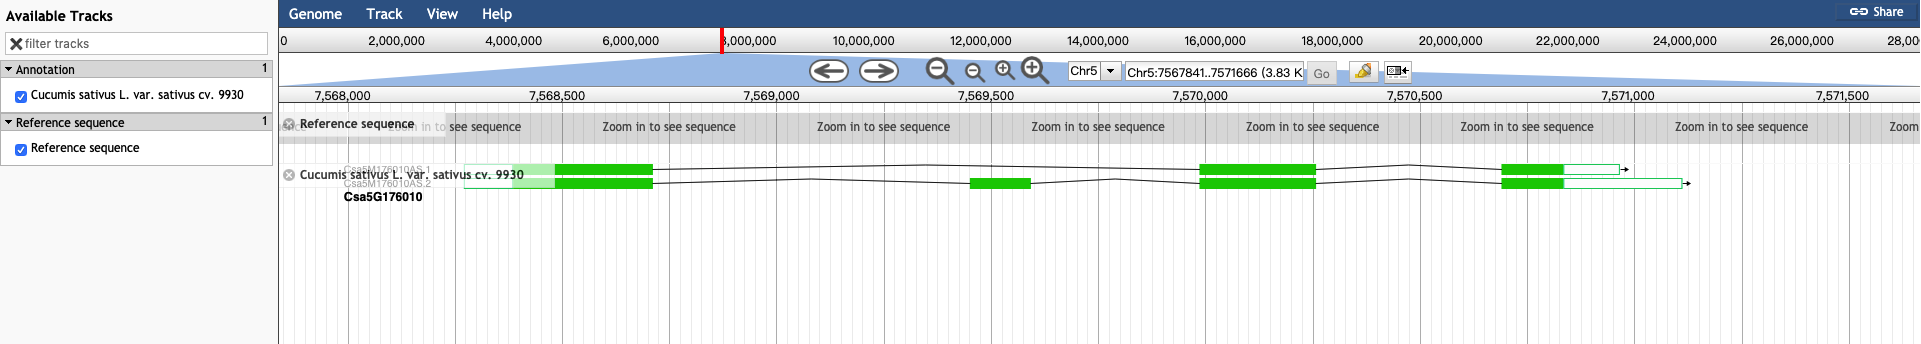
3.1 JBrowse
All the transcripts assembled from RNA-Seq data are displayed by JBrowse.
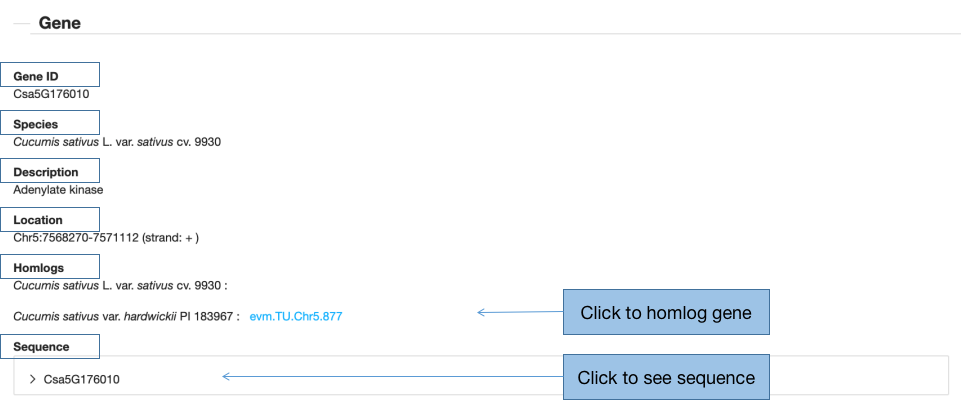
3.2 Gene
In this part, we list gene id, species, gene description, gene location and its homologs between the two cucumbers. After the click on the gene id (such as: Csa5G176010) in the result page, it will turn to the CuGenDB database. The sequences of the gene are available once clicking the gene ID. In addition, if you are interested in the homolog gene, you can obtain the information of the gene by clicking the homolog gene id.
3.3 Transcripts
The information of transcripts includes genomic location, expression level and alternative splicing events.
3.3.1 Location
In the location table, the position of the transcripts and the corresponding CDS encoded by the gene are listed.
3.3.2 Sequence
The sequences of transcripts and CDS are accessible if you click the “Transcript sequence” or “CDS sequence” and its ID below.
3.3.2 Expression
Expression values of tissues are measured by TPM for each transcript. This chart not only illustrates whether the transcripts are tissue-specific or common, but also points out the expression level.
3.3.3 Alternative Splicing Events
In this part, the type of AS events, location, PSI average and PSI range are listed. The PSI values are also visible below the table, which illustrate the dynamic of these events across the tissues.
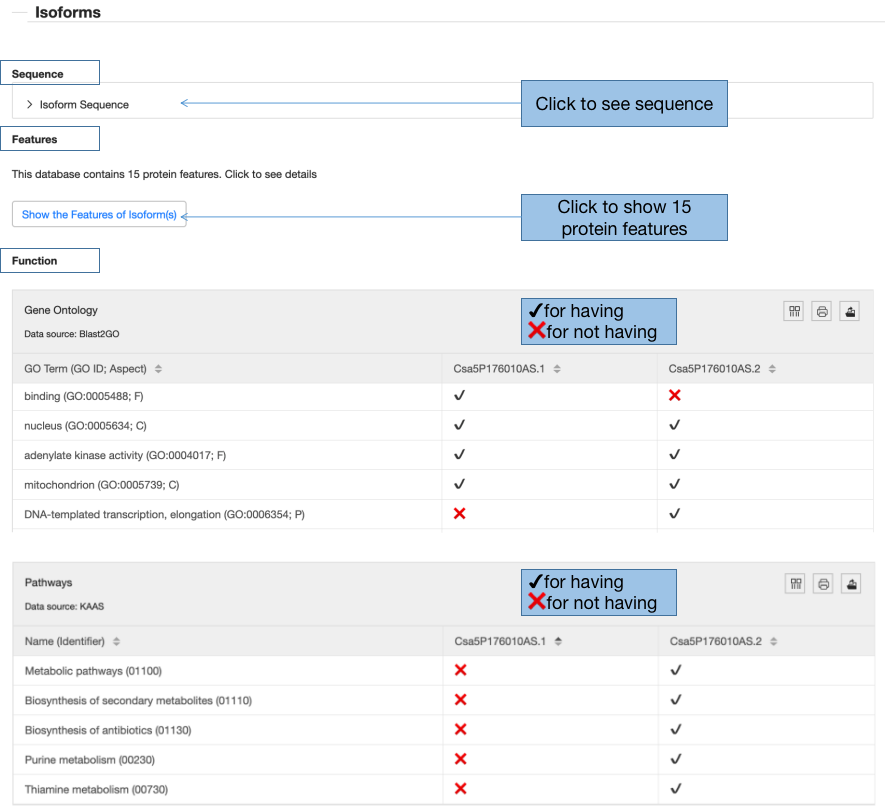
3.4 Isoforms
To illustrate the impact of alternative splicing on isoforms, all the features and functions are displayed at the isoform level.
3.4.1 Isoform Sequence
Isoform sequences can be obtained by clicking “Protein Sequence” and its isoform ID”.
3.4.2 Isoform features
Once clicking the button “Show the Features of Isoform(s)”, you can turn to the isoform feature page. All the features would be described in detail.
3.4.3 Isoform functions
CuAS demonstrates the functions from two ontologies: Gene ontology and KEGG. The first column lists the GO term or Pathway name, the other columns present having/not having the functions for the isoforms. If the isoform contains the function, it is marked by “√”, if not, marked by “x”. From the two tables, we can compare the functions between the two isoforms clearly.
4、 Isoform Features
The access to this page is available by two methods: (1) clicking the bottom “Show the Features of Isoform(s)” in the result page searched by gene. (2) the results of searching by the isoform ID. The page will be refreshed automatically by checking the isoforms.

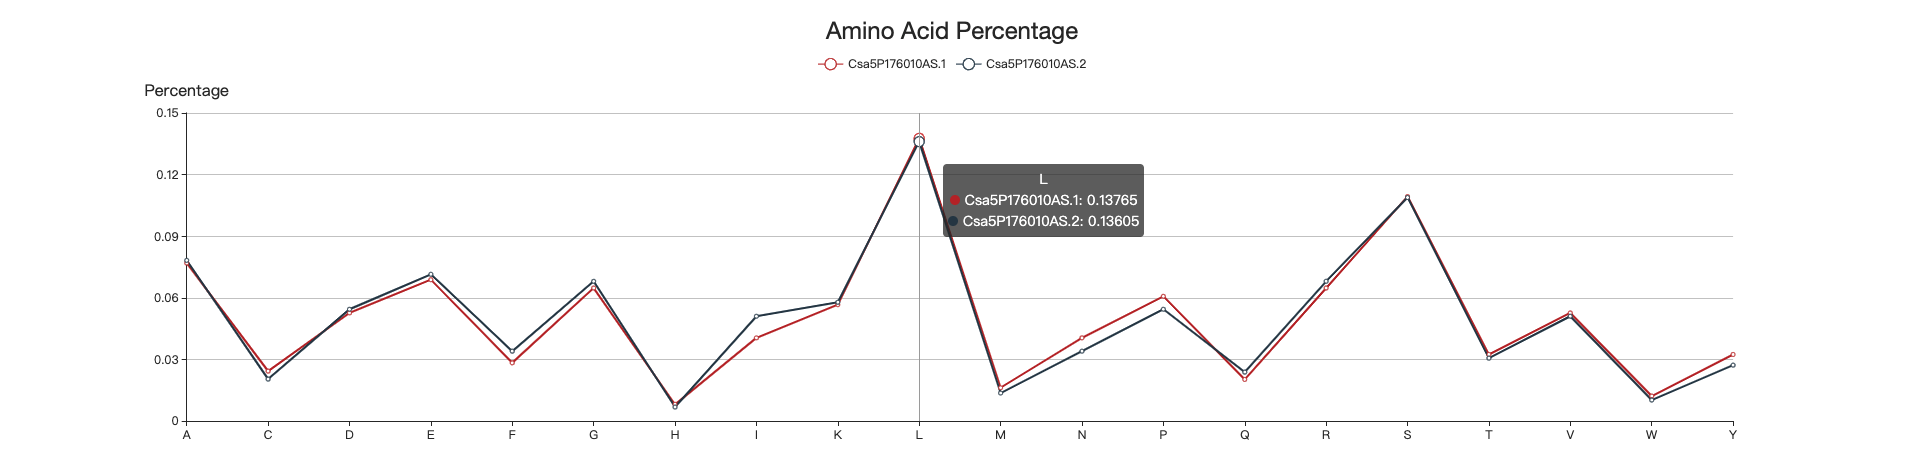
4.1 Amino acid percentage
The line chart illustrates the amino acid composition of the two isoforms. When mouse is hovering, the percentages of the amino acids of the two isoforms are shown.
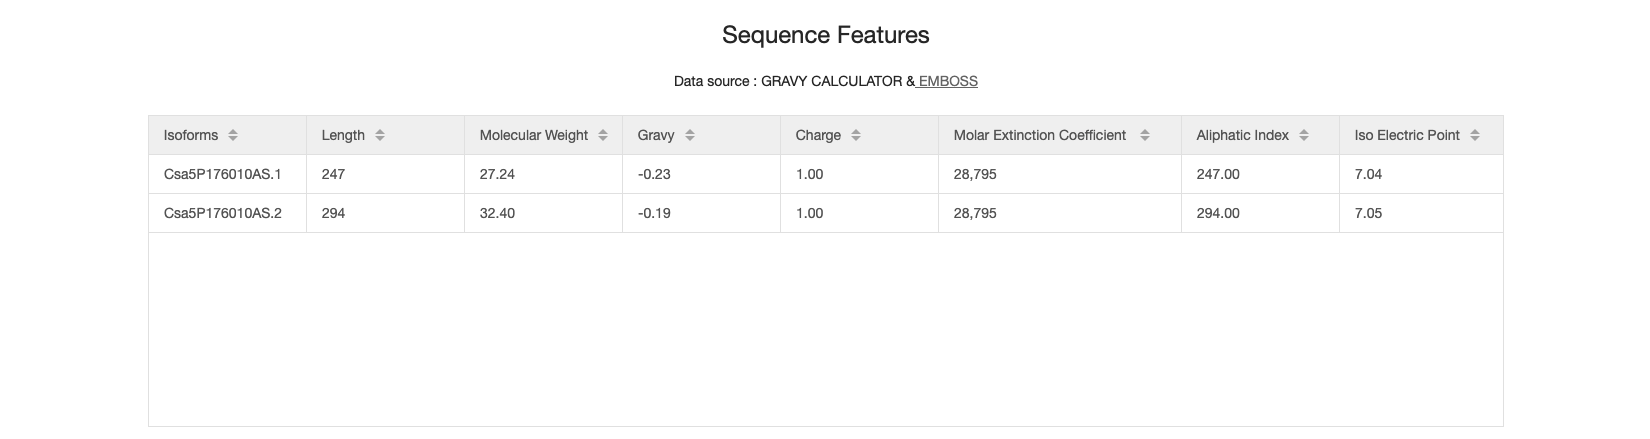
4.2 Sequence features
According to the amino acid sequence, a range of global features are calculated, including length, molecular weight, grave, charge, molar extinction coefficient, aliphatic index, iso electric point.
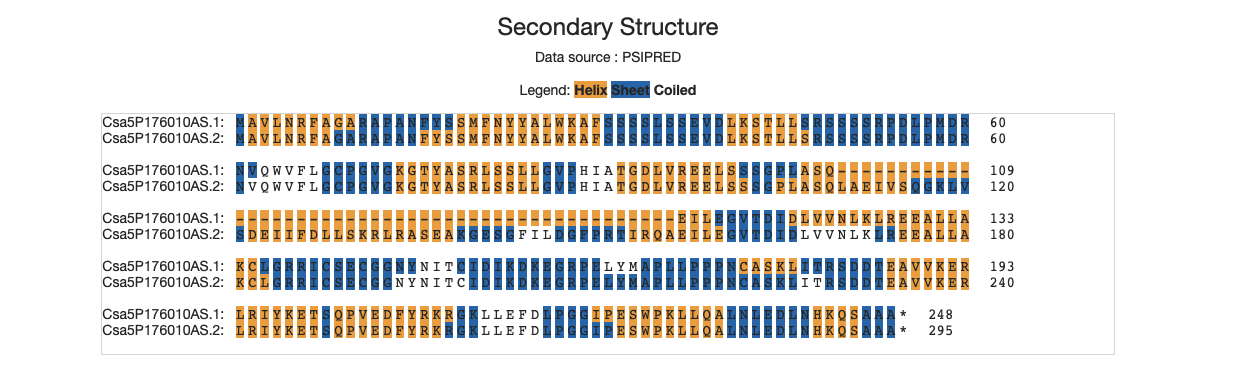
4.3 Secondary structure
The yellow regions mean the helix, while the dark blue ones represent the sheet. Other amino acids are likely to be coiled.
4.4 Coiled coils
In the amino acid sequence, the blue ones are coiled coils.

4.5 Low complexity regions
The dark blue amino acids show the features of low complexity.

4.6 PEST regions
The red regions mean they are possible to be PEST.

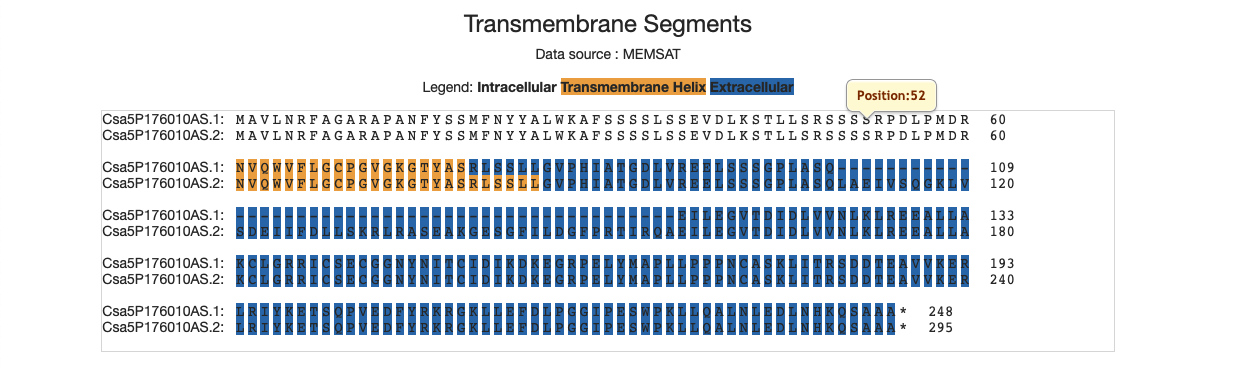
4.7 Transmembrance segments
This figure illustrates which part of the protein is across the membrance. The yellow region is in the transmembrance helix, and the blue region is in the extracellular, while other regions are in intracellular.
4.8 Intrinsically disordered regions
The red show the possibility of disorder.

4.9 Motifs
The table gives us the information about motif, such as the accession ID, motif name, start site, and end site. The below graph also illustrates the distribution of these motifs in details. Once the mouse is over the rectangular, all the data related to this motif are available.

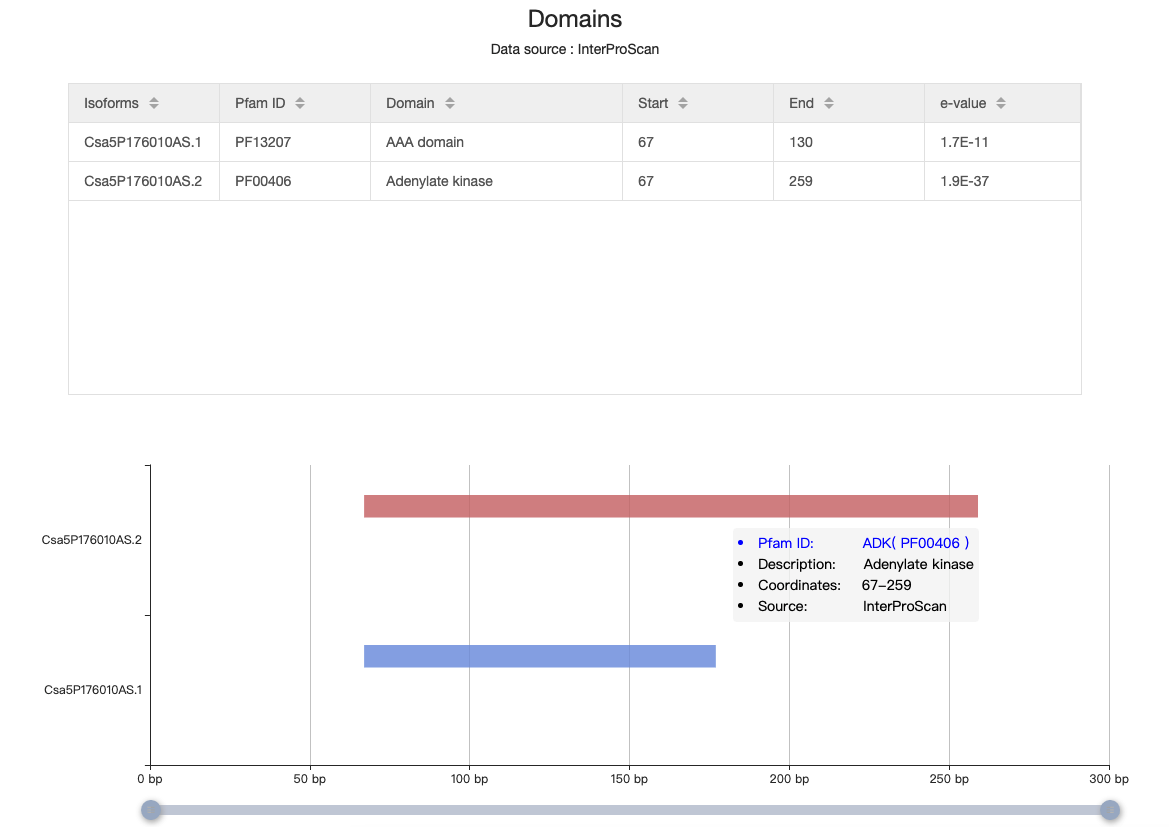
4.10 Domains
The table depicts the information related to domain, like Pfam ID, domain name, start and end site. The graph also illustrates the location of these domains in this isoform. Once the mouse is over the rectangular, all the information is visible.
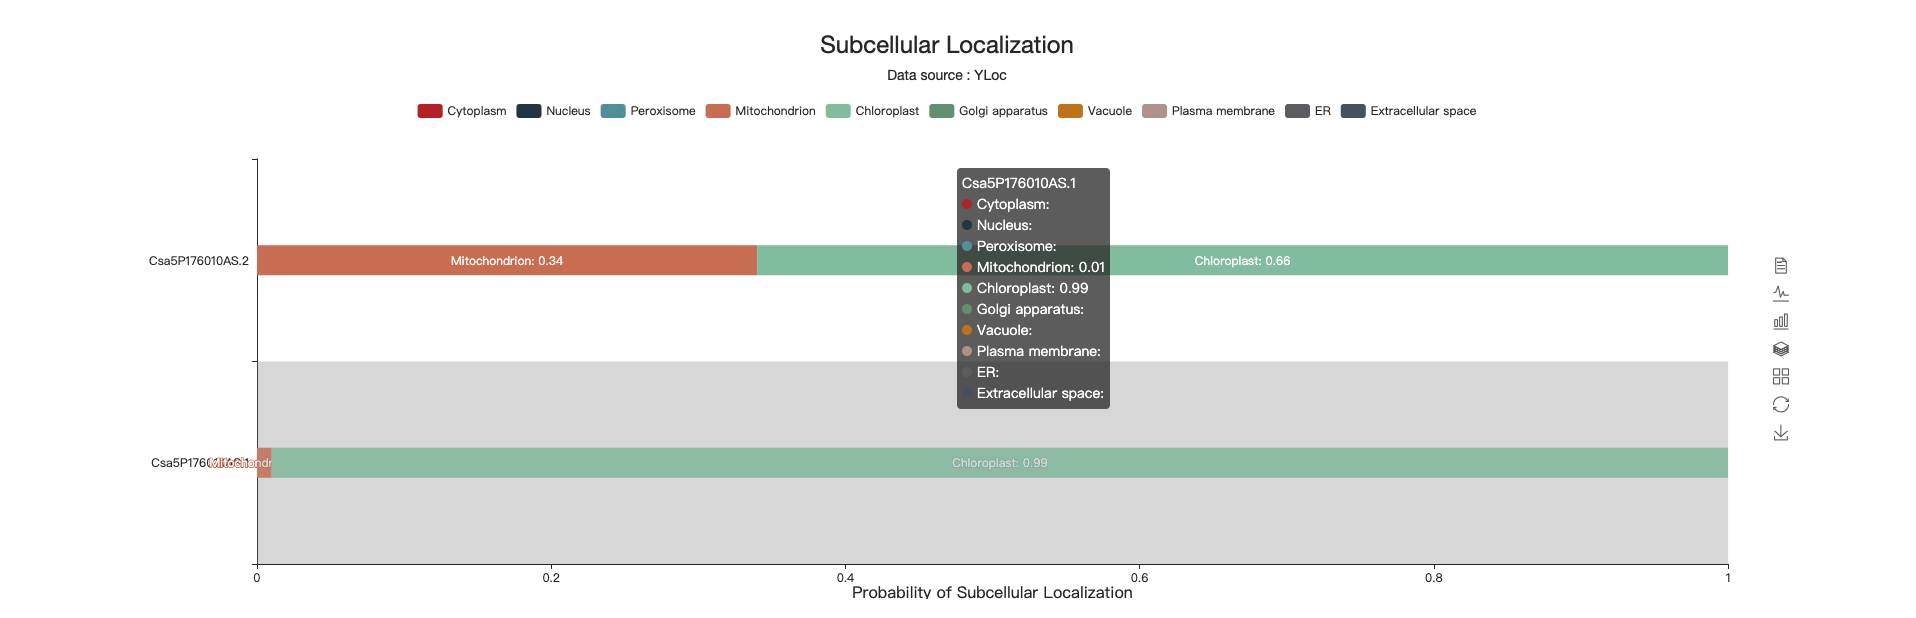
4.11 Subcellular location
This chart shows the probability of subcellular location.
4.12 Signal peptide
This part points out the status of signal peptide.

4.13 Phosphorylation sites
The red amino acids mean the potential of phosphorylation.

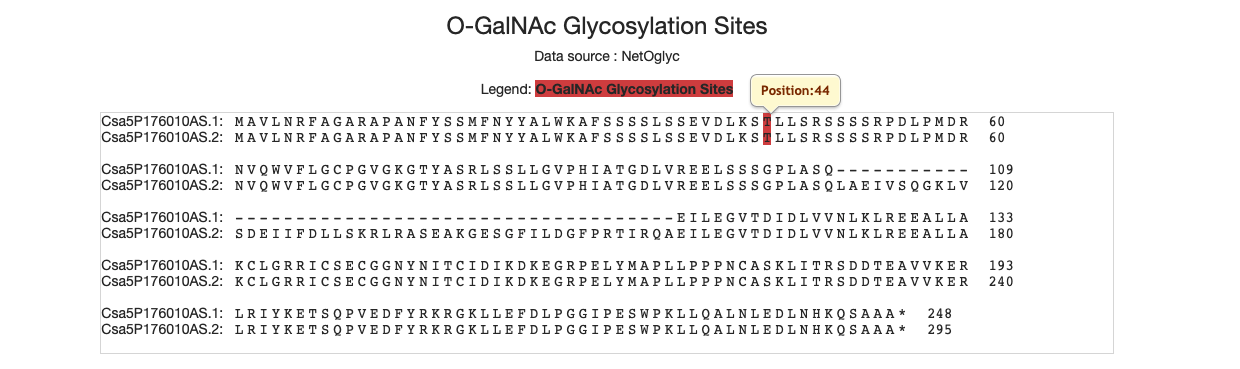
4.14 O-GalNAc-glycosylation sites
The red amino acids mean the sites of O Glycosylation.
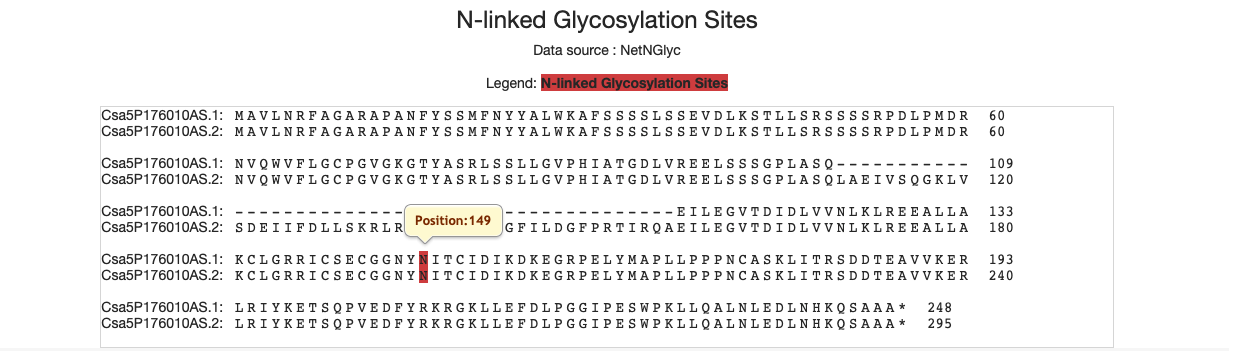
4.15 N-linked glycosylation sites
We use the red labels to represent the sites of N Glycosylation.
5、 Tools
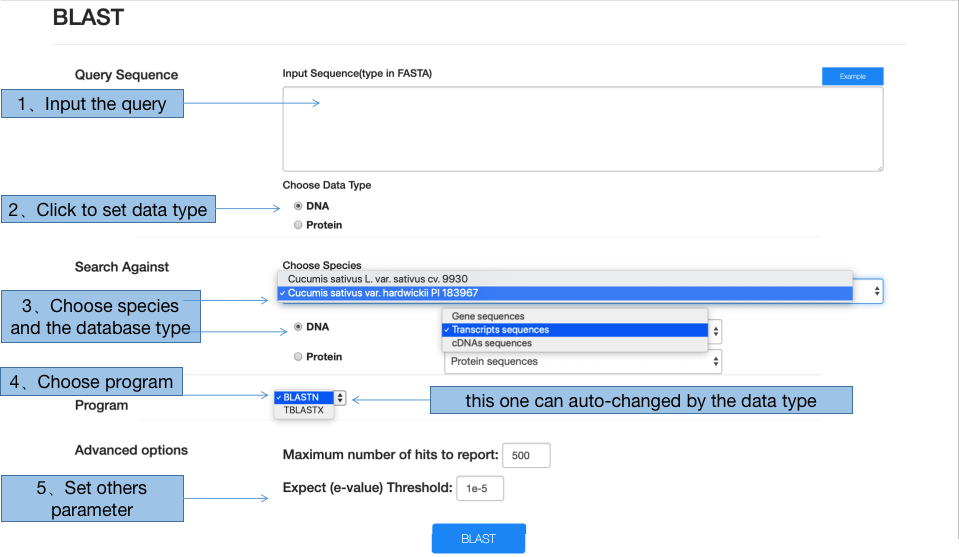
5.1 BLAST
Performing BLAST can be divided into 4 steps. First, input the sequence in fasta format and choose the data type. Second, choose the database from two aspects, including species and the type of sequence (gene, transcript, cds or protein). Third, select the appropriate program, although this part would be altered automatically according to the sequence type. Forth, the maximum number of hits and e-value are also supported to be modified according to your own situation.
In the Blast Result page, the Query IDs and the Hit IDs are list. Clicking the Hit ID can turn to the result page searched by gene directly.
5.2 JBrowse
In current version, two genomes are collected in CuAS. When entering this page, choosing the genome first. Then the genomic features of cucumbers can be browsed using JBrowse.
6、 Download
All the original files are supported to be download at this web page